What will you learn
We’ll see how to get started on Elastic Java APM using a simple Java CRUD app.
Introduction
Elasticsearch is a Java based distributed search engine used for building search engines, analyzing logs, storing metrics, security events, and even application traces, enabling distributing tracing for microservice environments. Elastic launched an Opensource Application Performance Monitoring (APM) in 2018 with Elasticsearch 6.2, enabling applications to ship their traces. APM today has many more features like correlations.
We’ll look at how to configure tracing for a Java Application using Java Agent and spin required infrastructure for APM deployment on Cloud. Elastic APM also supports Open Telemetry, and there is an elastic exporter too. But, we’re focussing on the native Elastic APM Java language agent.
Distributed Tracing
Distributed tracing helps you to understand the flow of requests happening in distributed microservices-based applications. We can do performance profiling, root cause analysis, find failures, errors, and exceptions!
Developers are intrigued by the microservices architecture with other ecosystem tools like Docker, Kubernetes, Java frameworks.
We replaced our monolith with micro services so that every outage could be more like a murder mystery. — @honest_update
High-level Architecture of Elastic APM
Microservice applications can essentially contain services from different programming languages talking to each other, sharing information.
Elastic APM agents are Java Jar’s, Nodejs packages, or Python packages, configured to collect data from applications. Below is the high-level architecture diagram of how the data flows.
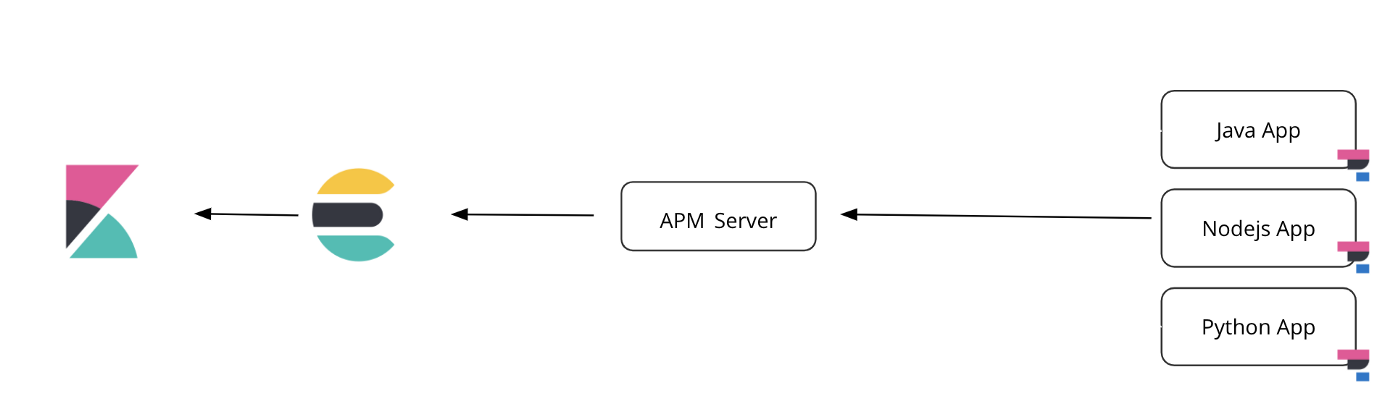
APM server receives all the data from various applications and creates the documents in Elasticsearch.
Java CRUD Application
Java Application stores student details like Id, Name, Age. You can add additional properties if you wish you.
The application has two endpoints:
- /student : GET, POST, PUT, DELETE
- /school/_count : finds the count of students.
Creating an APM deployment:
I’m using Elastic Cloud to deploy the Elastic APM deployment. You can start a trial and spin up a deployment. Alternatively, you could also deploy Elasticsearch, Kibana, and APM Server by downloading binaries.
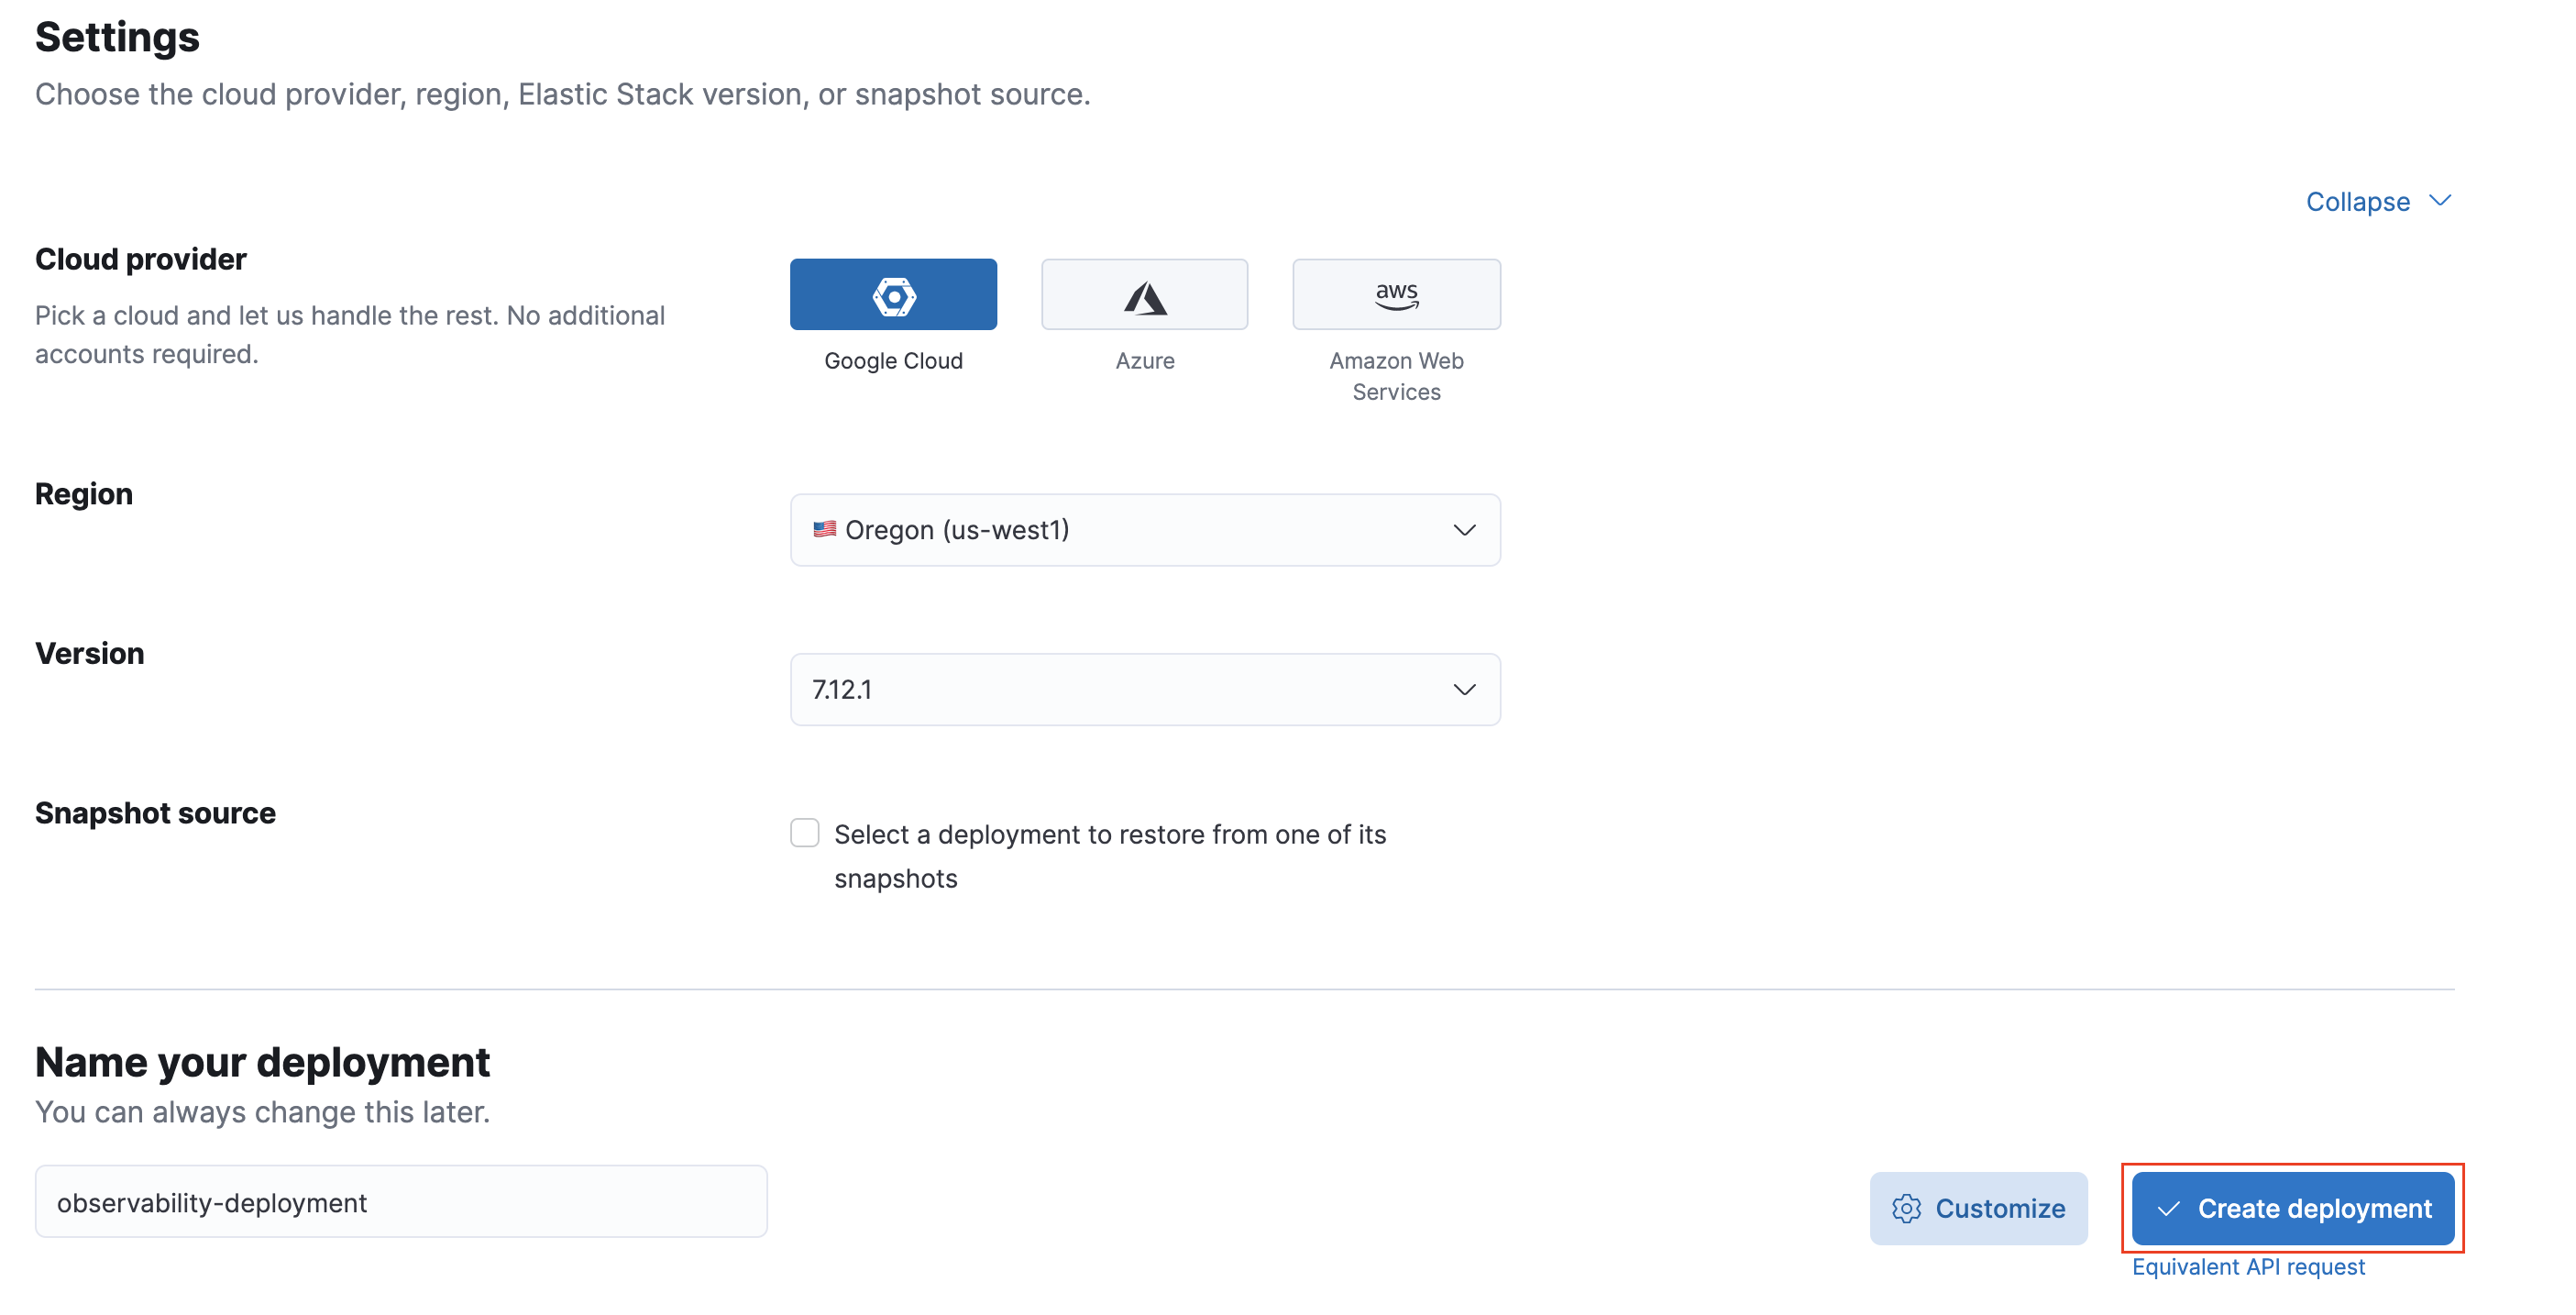
Choose any cloud vendor, preferably the latest version of Elastic Stack, and click Create deployment. Optionally, you can choose to click on Customize the deployment by adding additional hardware tiers (warm, cold).
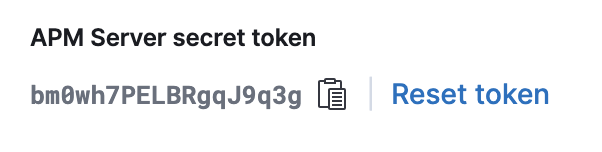
Once the deployment is created, you need to copy the APM server URL and the secret token.
- Click on the “APM” link on the left menu
- We will need the APM Server secret token:
Clone the repository
git clone https://github.com/aravindputrevu/javalin-student.git
After cloning, notice the file under the resources folder. Add the APM Server URL, secret token copied from console to server_urls and secret_token.
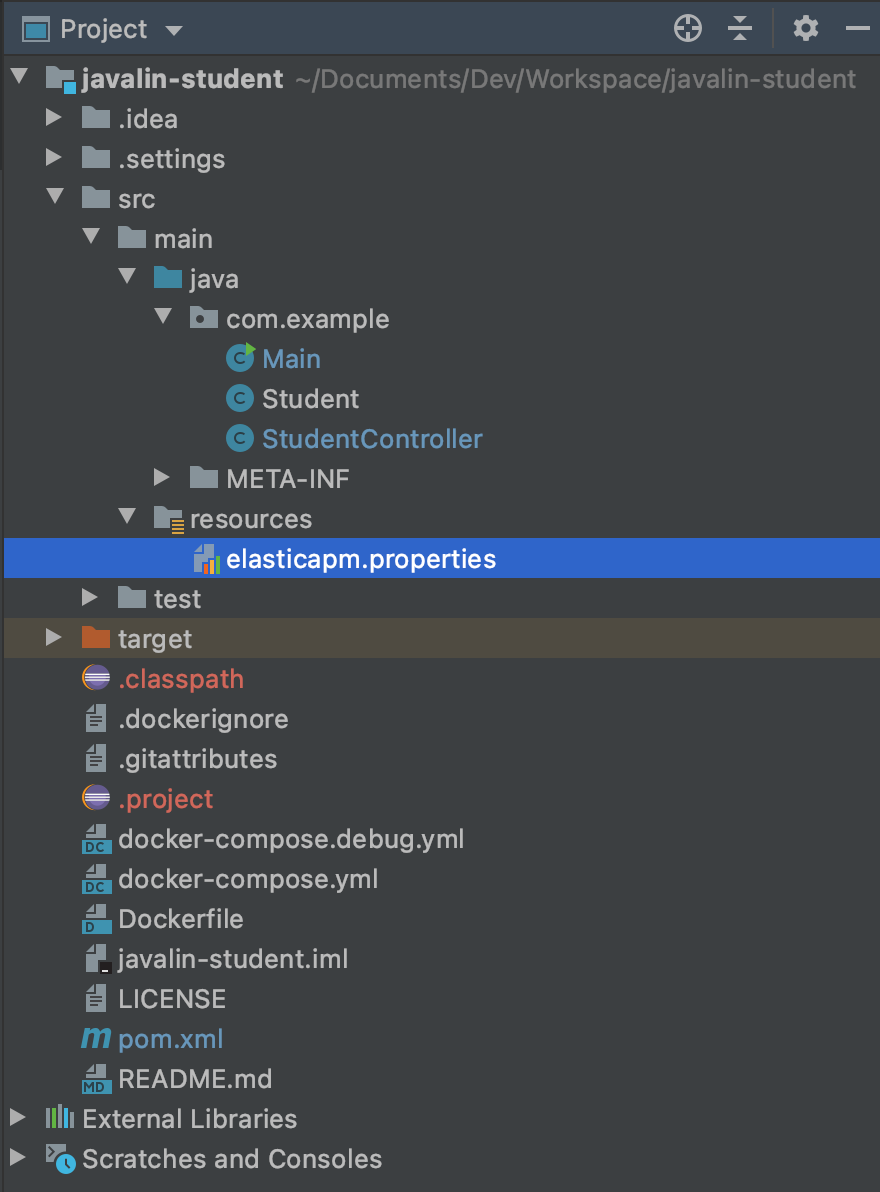
elasticapm.properties
service_name=javalin
application_packages=com.example
server_urls=
secret_token=
Building application
Dependencies
In the root folder of the source, you can find the project. There are very few dependencies like Javalin, sl4j, and Jackson.
<dependencies>
    <dependency>
        <groupId>io.javalin</groupId>
        <artifactId>javalin</artifactId>
        <version>3.13.13</version>
    </dependency>
    <dependency>
        <groupId>org.slf4j</groupId>
        <artifactId>slf4j-simple</artifactId>
        <version>1.7.30</version>
    </dependency>
     <dependency>
         <groupId>com.fasterxml.jackson.core</groupId>
         <artifactId>jackson-databind</artifactId>
         <version>2.11.2</version>
     </dependency>
</dependencies>
Execute mvn clean , mvn install to generate the jar under target folder.
Note: You need to have maven installed on your machine (which Java dev doesn’t have ant, maven, gradle on their laptop! 😉)
To start the application: java -jar target/javalin-student-1.0-snapshot.jar
You could use a REST client like Postman or a command-line tool like cURL to check the application endpoints.
Create:
$ curl -X POST -H "Content-Type: application/json" http://localhost:8080/students -d '{ "id": "003","name": "Javalin","age": 15}'
$ curl -X POST -H "Content-Type: application/json" http://localhost:8080/students -d '{ "id": "005","name": "Micronaut","age": 12}'
$ curl -X POST -H "Content-Type: application/json" http://localhost:8080/students -d '{ "id": "001","name": "Quarkus","age": 16}'
Read:
$ curl -X GET http://localhost:8080/students
$ curl -X GET http://localhost:8080/students/003
Update:
$ curl -X PATCH -H "Content-Type: application/json" http://localhost:8080/students -d '{ "id": "001","name": "Quarkus","age": 32}'
Delete:
$ curl -X DELETE http://localhost:8080/students/001
Count:
$ curl -X GET http://locahost:8080/school/_count
Tracing the application
We have not started tracing our application yet. You need to download the Java agent from maven central and place it under the project’s root folder.
There are three ways to set up the agent:
- Using -javaagent flag.
- Using apm-agent-attach-standalone.jar — Beta
- Using programmatic attach. — Beta
We’ll be using Option#1, javaagent method.
You need to start the application with javaagent flag as shown in the example below.
$ java -javaagent:elastic-apm-agent-1.22.0.jar -jar target/javalin-student-1.0-SNAPSHOT.jar
Note: You can also configure supported application servers as mentioned in the documentation.
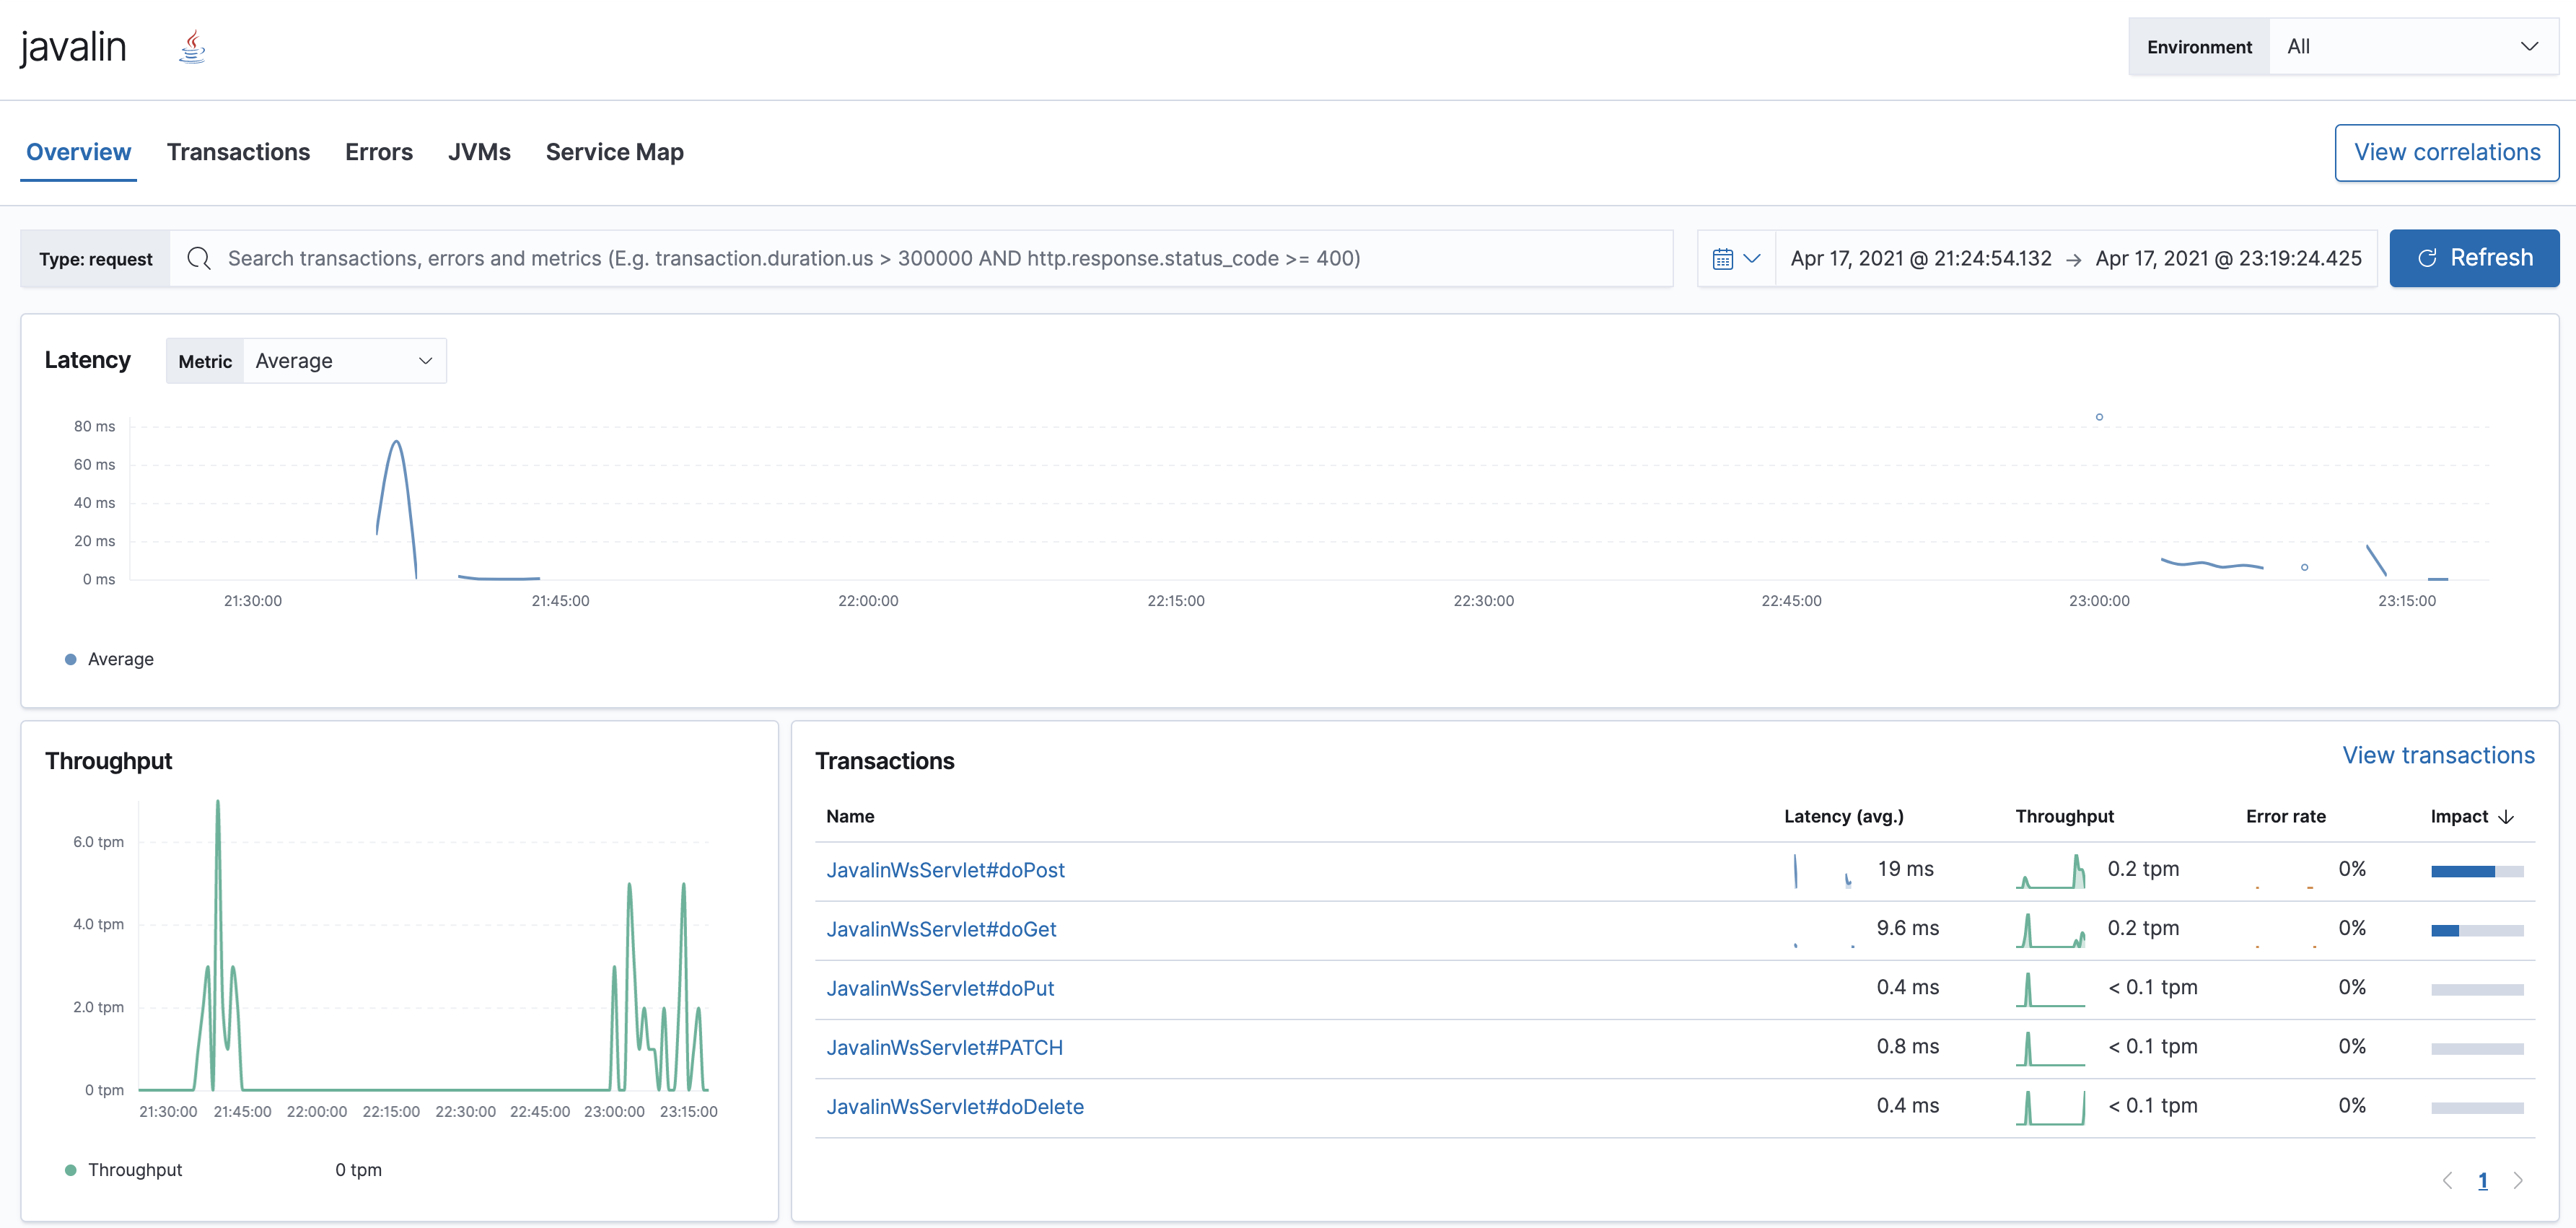
Viewing Application Traces in Kibana
When you start accessing the application endpoints, you should see data in the Kibana -> Observability -> APM (https://<kibana_host>/app/apm)
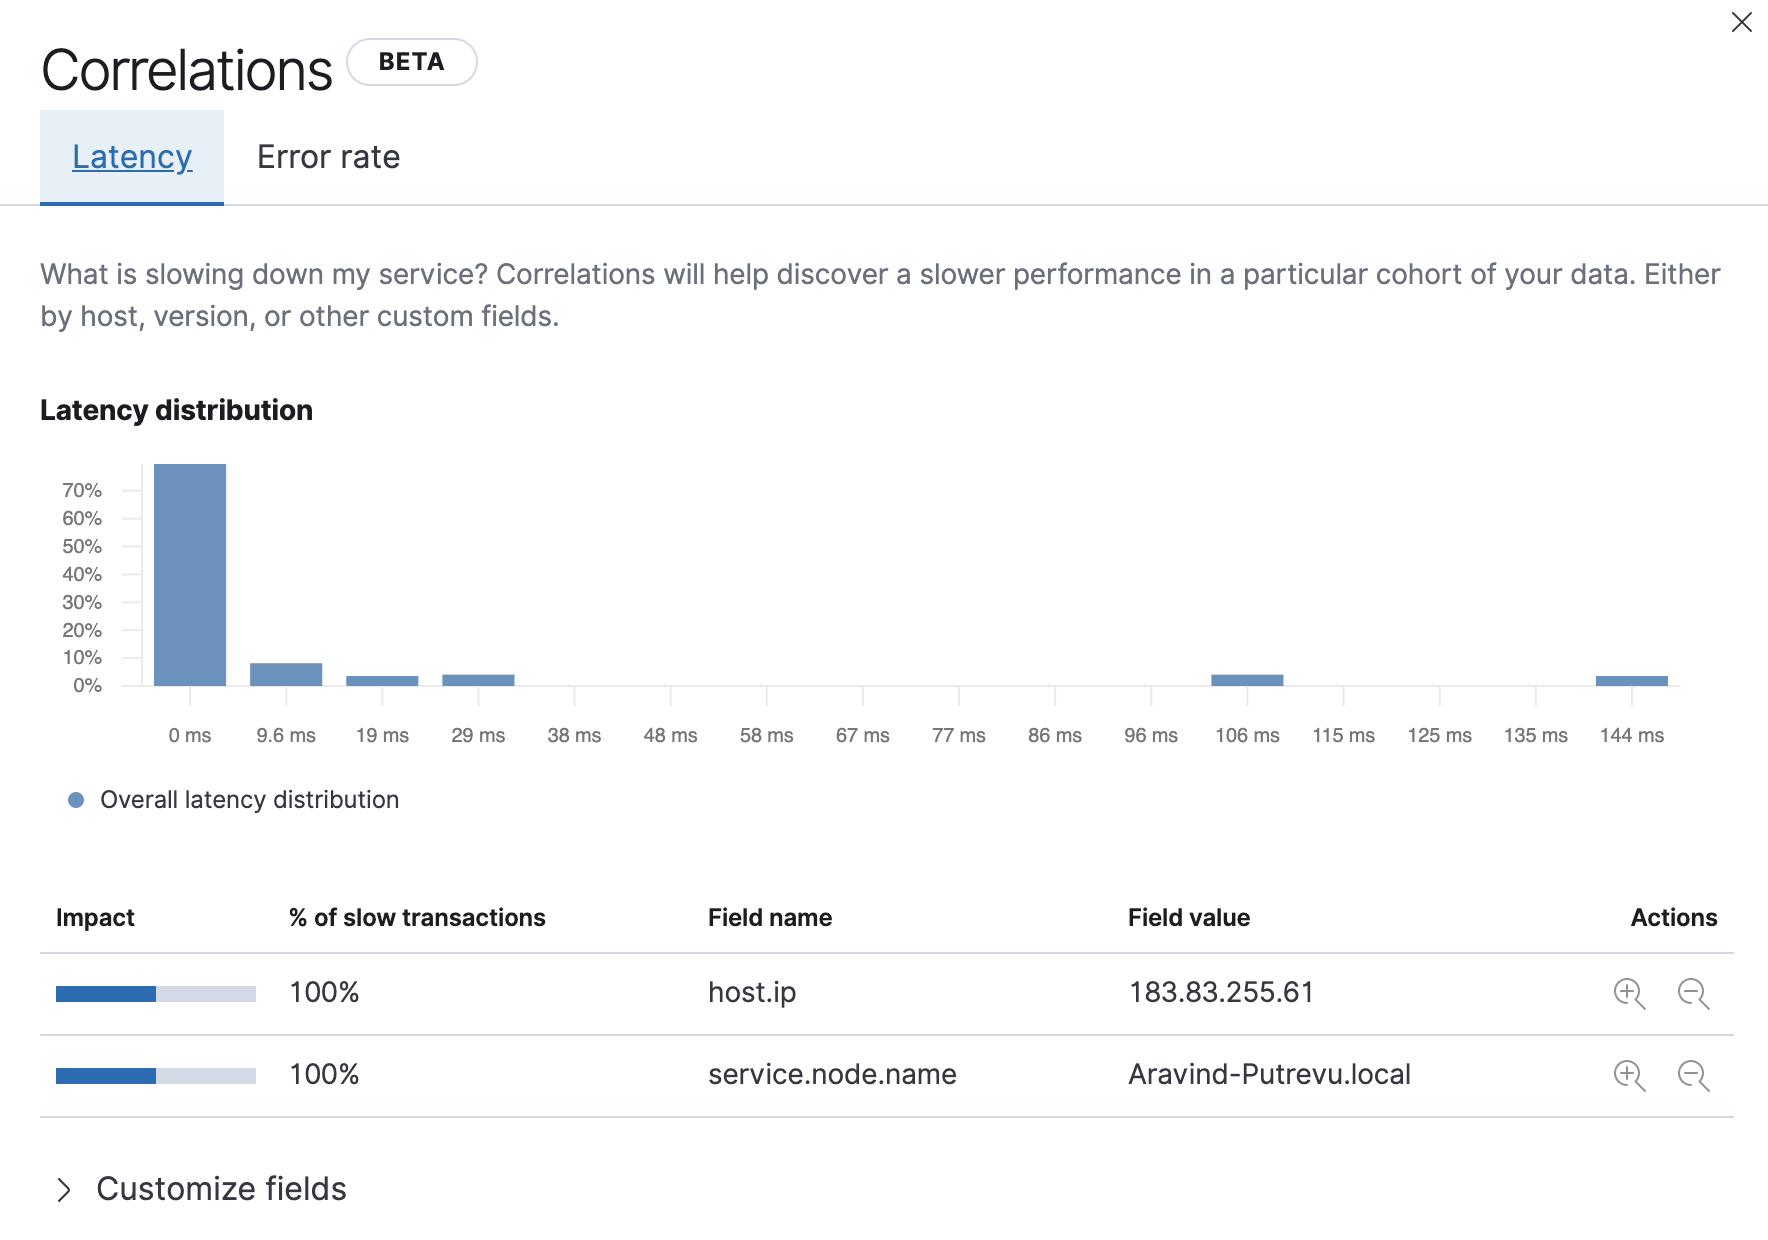
You could observe the slower performance, error rate with specific fields using Correlations. It uses the significant terms aggregation of Elasticsearch under the hood to provide this information.
This not it. You could create a specific threshold, latency alerts, find errors from the error panel, Create spans for specific methods using @CaptureSpan annotation.
In addition to all this, you could enable log correlation to find logs belonging to a specific trace or vice versa. Elastic provides ECS logging libraries to do structured logging from your application and directly ingest it to Elasticsearch.
Conclusion
It is easy to get started with Elastic Java APM. Most application servers and frameworks are supported. You could also use the public API to create traces, transactions manually.
Note: You could use VS Code or IntelliJ to add code. Either way, there is a pom.xml at the root of the project.