Dependencies
First, we need to create a Maven project with some dependencies: (→ Tutorial)
We need Javalin for our server and Prometheus for monitoring.
We’ll also add unirest for simulating traffic:
<dependencies>
    <dependency>
        <groupId>io.javalin</groupId>
        <artifactId>javalin-bundle</artifactId>
        <version>6.7.0</version>
    </dependency>
    <dependency>
        <groupId>io.prometheus</groupId>
        <artifactId>simpleclient_httpserver</artifactId>
        <version>0.16.0</version>
    </dependency>
    <dependency>
        <groupId>com.konghq</groupId>
        <artifactId>unirest-java</artifactId>
        <version>3.13.10</version>
    </dependency>
</dependencies>
Now that we have that all setup, we need to make Prometheus gather data from our application.
Luckily there is a handler in Jetty called StatisticsHandler.
We can add this to Javalin’s embedded server, and use it to expose statistics to prometheus.
We can also do the same with the QueuedThreadPool that Jetty uses:
- Java
- Kotlin
public static void main(String[] args) throws Exception {

    StatisticsHandler statisticsHandler = new StatisticsHandler();
    QueuedThreadPool queuedThreadPool = new QueuedThreadPool(200, 8, 60_000);

    Javalin app = Javalin.create(config -> {
        config.jetty.threadPool = queuedThreadPool;
        config.jetty.modifyServer(server -> {
            server.setHandler(statisticsHandler);
        });
    }).start(7070);
    initializePrometheus(statisticsHandler, queuedThreadPool);
}

private static void initializePrometheus(StatisticsHandler statisticsHandler, QueuedThreadPool queuedThreadPool) throws IOException {
    StatisticsHandlerCollector.initialize(statisticsHandler);
    QueuedThreadPoolCollector.initialize(queuedThreadPool);
    HTTPServer prometheusServer = new HTTPServer(7080);
    LoggerFactory.getLogger("JavalinPrometheusExampleApp").info("Prometheus is listening on: http://localhost:7080");
}
fun main() {

    val statisticsHandler = StatisticsHandler()
    val queuedThreadPool = QueuedThreadPool(200, 8, 60_000)

    val app = Javalin.create {
        it.jetty.threadPool = queuedThreadPool
        it.jetty.modifyServer {
            it.handler = statisticsHandler
        }
    }.start(7070)
    initializePrometheus(statisticsHandler, queuedThreadPool)
}

private fun initializePrometheus(statisticsHandler: StatisticsHandler, queuedThreadPool: QueuedThreadPool) {
    StatisticsHandlerCollector.initialize(statisticsHandler)
    QueuedThreadPoolCollector.initialize(queuedThreadPool)
    val prometheusServer = HTTPServer(7080)
    LoggerFactory.getLogger("JavalinPrometheusExampleApp").info("Prometheus is listening on: http://localhost:7080")
}
In the above code we first create two objects we want to expose to Prometheus: StatisticsHandler and QueuedThreadPool.
We then call initializePrometheus which registers collectors for these objects, and starts a Prometheus server.
If you are familiar with how Prometheus/Grafana works, you can stop reading the tutorial now and start scraping from the server running on port 7080.
If not, please read on.
Exporting statistics using Prometheus-client
To collect data using Prometheus you need to create object which extends Collector.
In the source code you’ll find two such objects: StatisticsHandlerCollector
and QueuedThreadPoolCollector.
You have to call .register() when creating a collector, and you have to override the collect() method.
The two collectors included in the source code could also be included as a maven dependency, but I included them to illustrate how you can create custom collectors.
Simulating some traffic
To make sure that everything works, it’s good to have some traffic to look at.
So, we need to declare a few endpoints and make requests to them. Let’s add this to our public static void main:
- Java
- Kotlin
router.apiBuilder(() -> { // available on config.router inside Javalin.create()
    get("/1", ctx -> ctx.result("Hello World"));
    get("/2", ctx -> {
        Thread.sleep((long) (Math.random() * 2000));
        ctx.result("Slow Hello World");
    });
    get("/3", ctx -> ctx.redirect("/2"));
    get("/4", ctx -> ctx.status(400));
    get("/5", ctx -> ctx.status(500));
});

while (true) {
    spawnRandomRequests();
}
router.apiBuilder { // available on config.router inside Javalin.create()
    get("/1") { ctx -> ctx.result("Hello World") }
    get("/2") { ctx ->
        Thread.sleep((Math.random() * 2000).toLong())
        ctx.result("Slow Hello World")
    }
    get("/3") { ctx -> ctx.redirect("/2") }
    get("/4") { ctx -> ctx.status(400) }
    get("/5") { ctx -> ctx.status(500) }
}

while (true) {
    spawnRandomRequests()
}
spawnRandomRequests() doesn’t exist yet, so we need to create that too:
- Java
- Kotlin
private static void spawnRandomRequests() throws InterruptedException {
    new Thread(() -> {
        for (int i = 0; i < new Random().nextInt(50); i++) {
            Unirest.get("http://localhost:7070/1").asString(); // we want a lot more "200 - OK" traffic
            Unirest.get("http://localhost:7070/" + (1 + new Random().nextInt(5))).asString(); // hit a random (1-5) endpoint
        }
    }).start();
    Thread.sleep((int) (Math.random() * 250));
}
private fun spawnRandomRequests() {
    Thread {
        for (i in 0 until (0..50).shuffled()[0]) {
            Unirest.get("http://localhost:7070/1").asString() // we want a lot more "200 - OK" traffic
            Unirest.get("http://localhost:7070/" + (1..5).shuffled()[0]).asString() // hit a random (1-5) endpoint
        }
    }.start()
    Thread.sleep((Math.random() * 250).toLong())
}
The above code creates a thread every ~0-250ms, and that thread performs ~0-100 request, mostly to the /1 endpoint.
Viewing data in Prometheus
Now that we have collectors and fake data, we can finally view some graphs. To do this you have to setup Prometheus locally. The Prometheus people have a very nice getting started guide, which you can find on their pages: https://prometheus.io/docs/prometheus/latest/getting_started/
You need to adjust the prometheus.yml file to scrape the endpoint we just exposed. This is the scrape-config I’m using:
scrape_configs:
  - job_name: 'javalin'
    scrape_interval: 1s
    static_configs:
      - targets: ['localhost:7080']
        labels:
          group: 'test'
Prometheus then needs to be started with this config:
prometheus --config.file=prometheus.yml
Now you can go to localhost:9090 and use Prometheus:
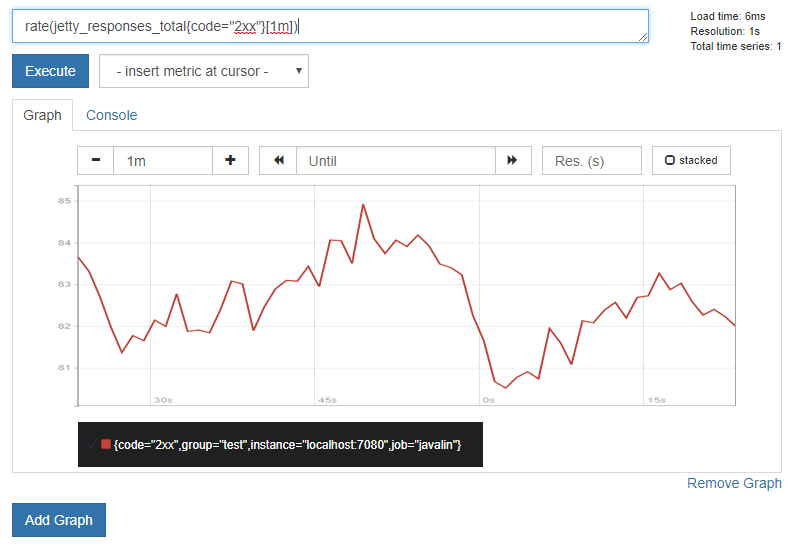
Prometheus isn’t very good for visualizing data though, they recommend you use Grafana for that: https://prometheus.io/docs/visualization/grafana/
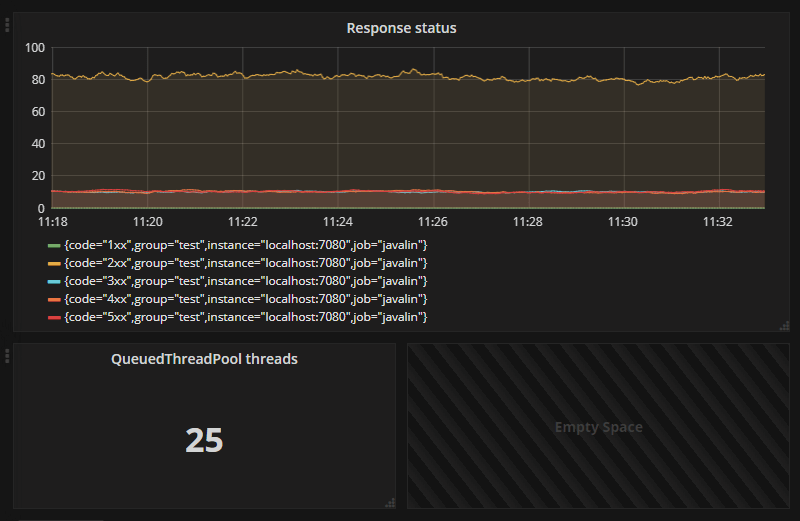
You can follow their guide for connecting grafana to prometheus, and when you’re done you’ll be able to make dashboards like this: